PSKE - Basic monitoring
less than a minute
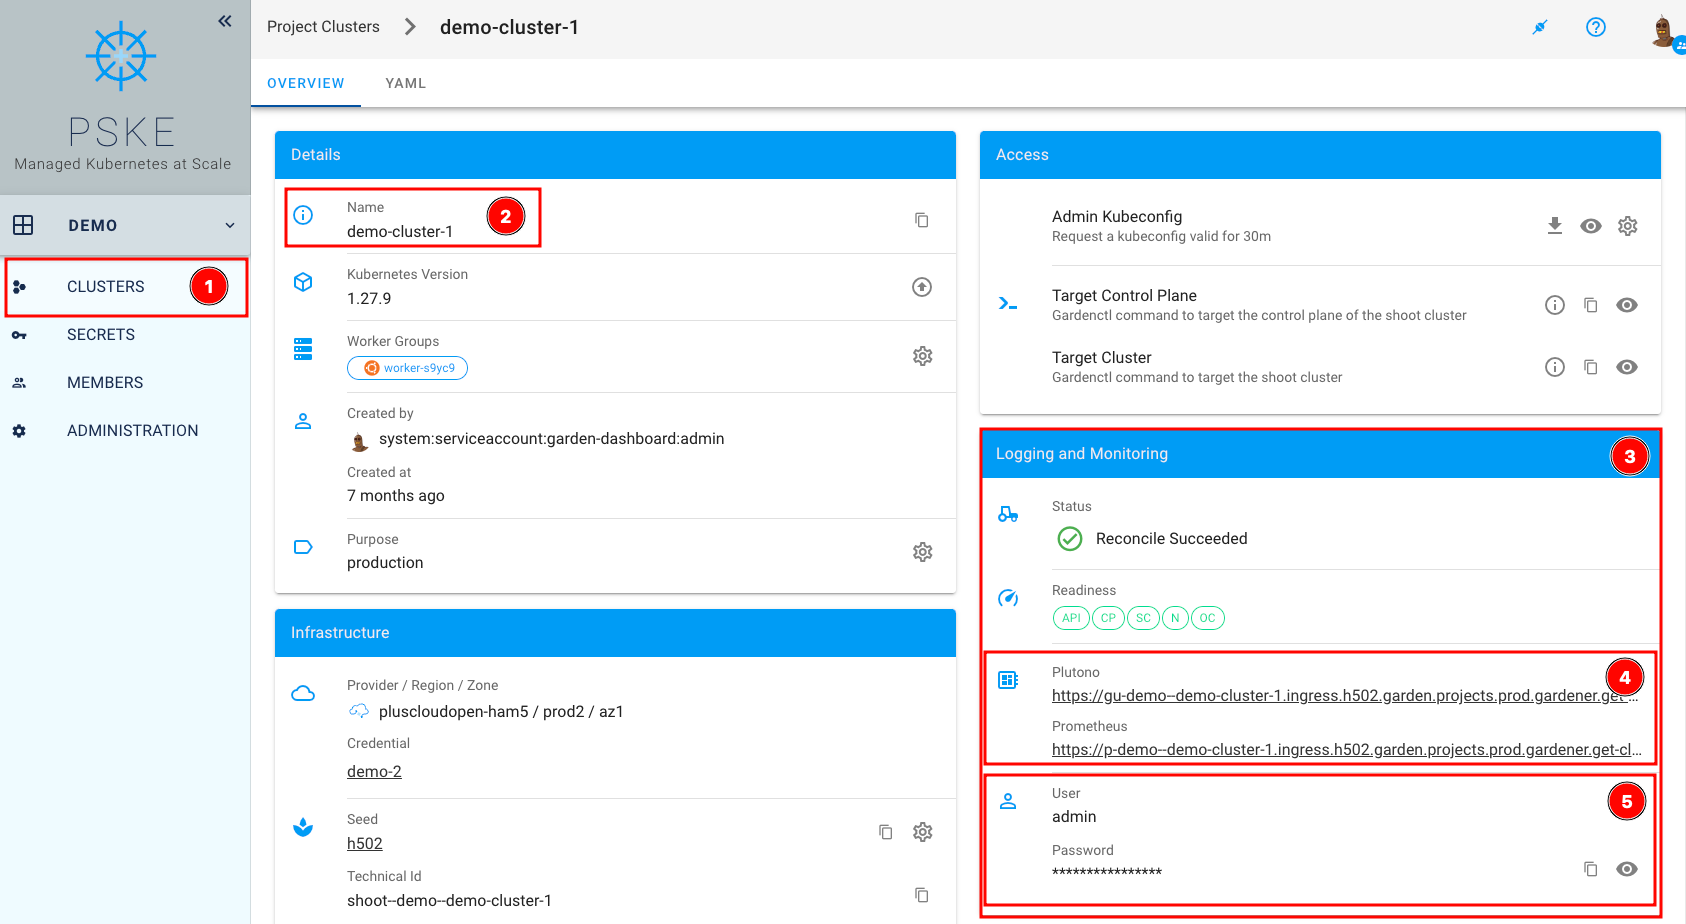
If you have monitoring enabled in your cluster, you can access the Grafana credentials (3) through the project (1) and the corresponding cluster (2) by following these steps: Visit the Grafana link (4) and copy the credentials (5) by clicking on the respective button.
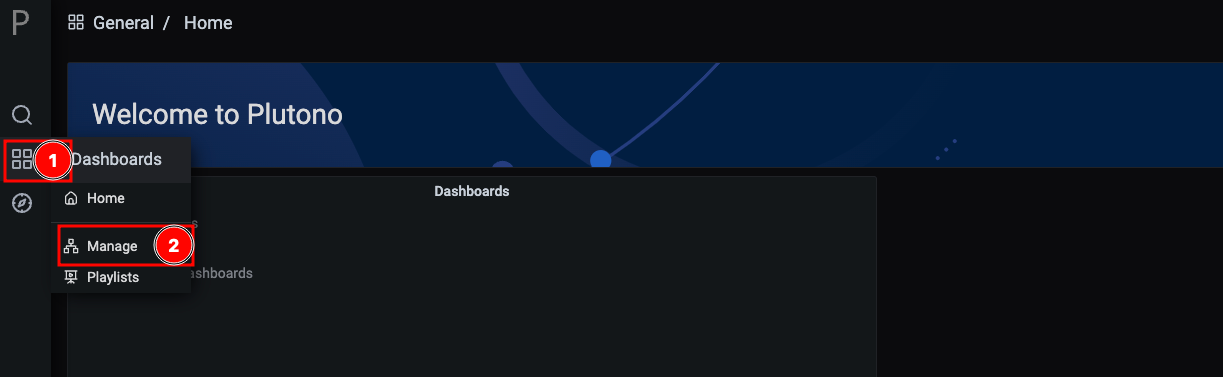
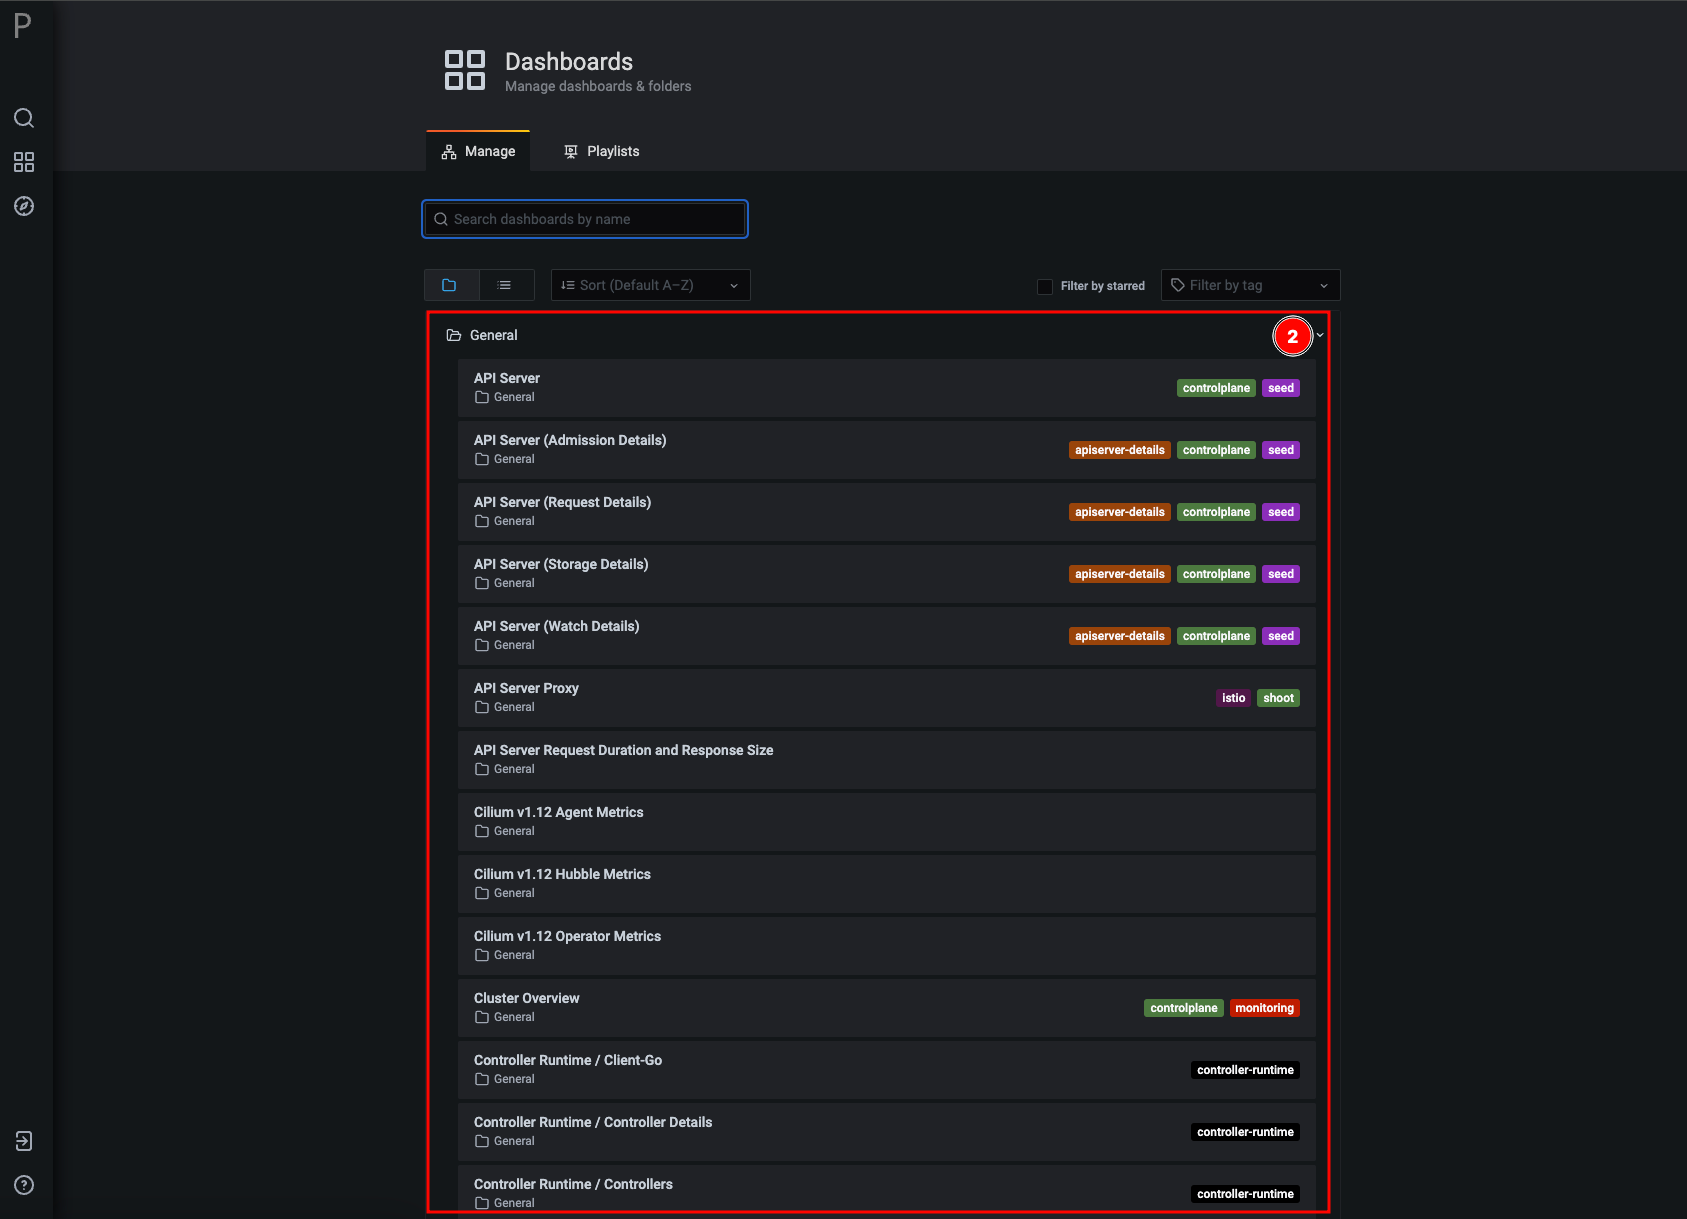
Once you’ve logged in, you’ll see the Grafana interface. Click on the magnifying glass (1) to access a list of preconfigured dashboards (2).