PSKE - Basic monitoring
4 minute read
Every PSKE cluster includes an integrated monitoring stack consisting of Prometheus for metrics collection and Grafana for visualization. All dashboards operate in the Gardener Shoot context — covering the Kubernetes cluster including its control plane.
Accessing Grafana
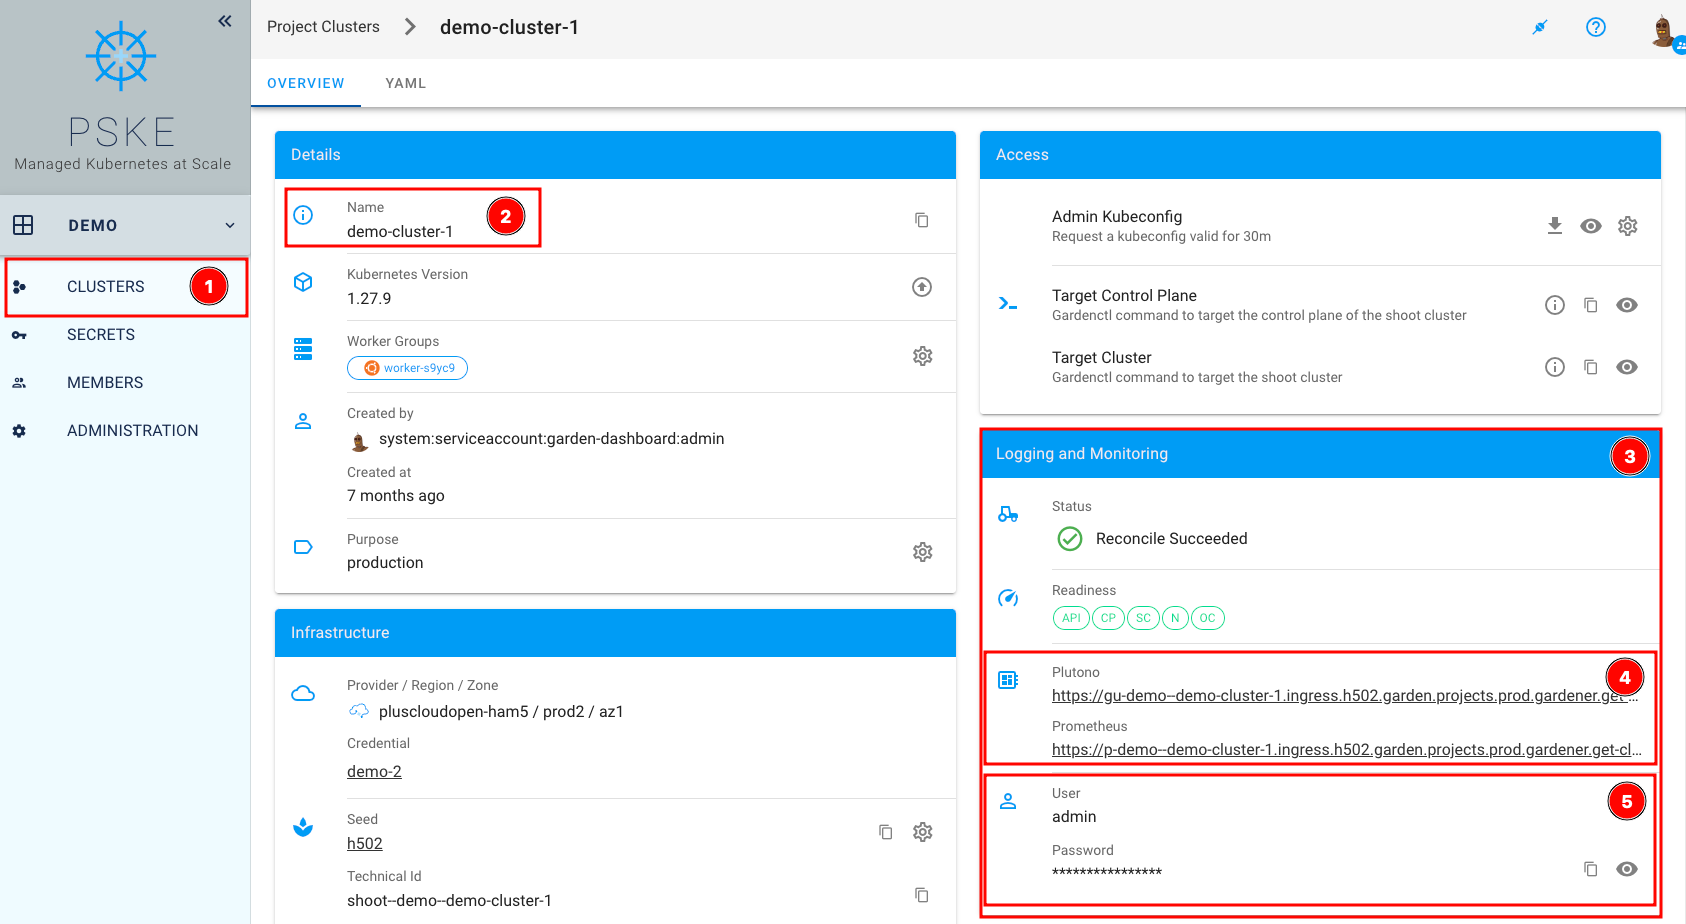
When monitoring is enabled for a cluster, the Grafana credentials are available directly in the PSKE dashboard. Navigate to the relevant project (1) and cluster (2) to find the Grafana credentials (3) and direct link (4). Credentials can be copied with a single click (5).
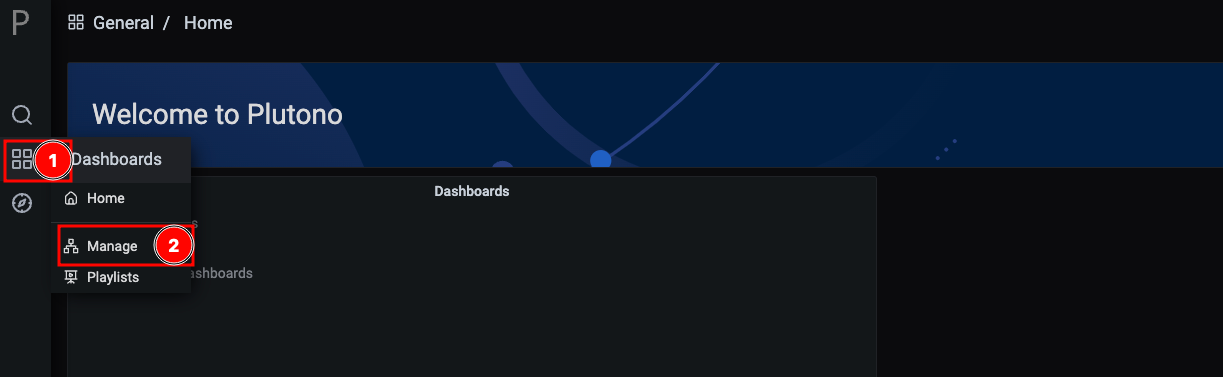
After logging in, the Grafana interface opens. Use the magnifying glass (1) to access the list of preconfigured dashboards (2).
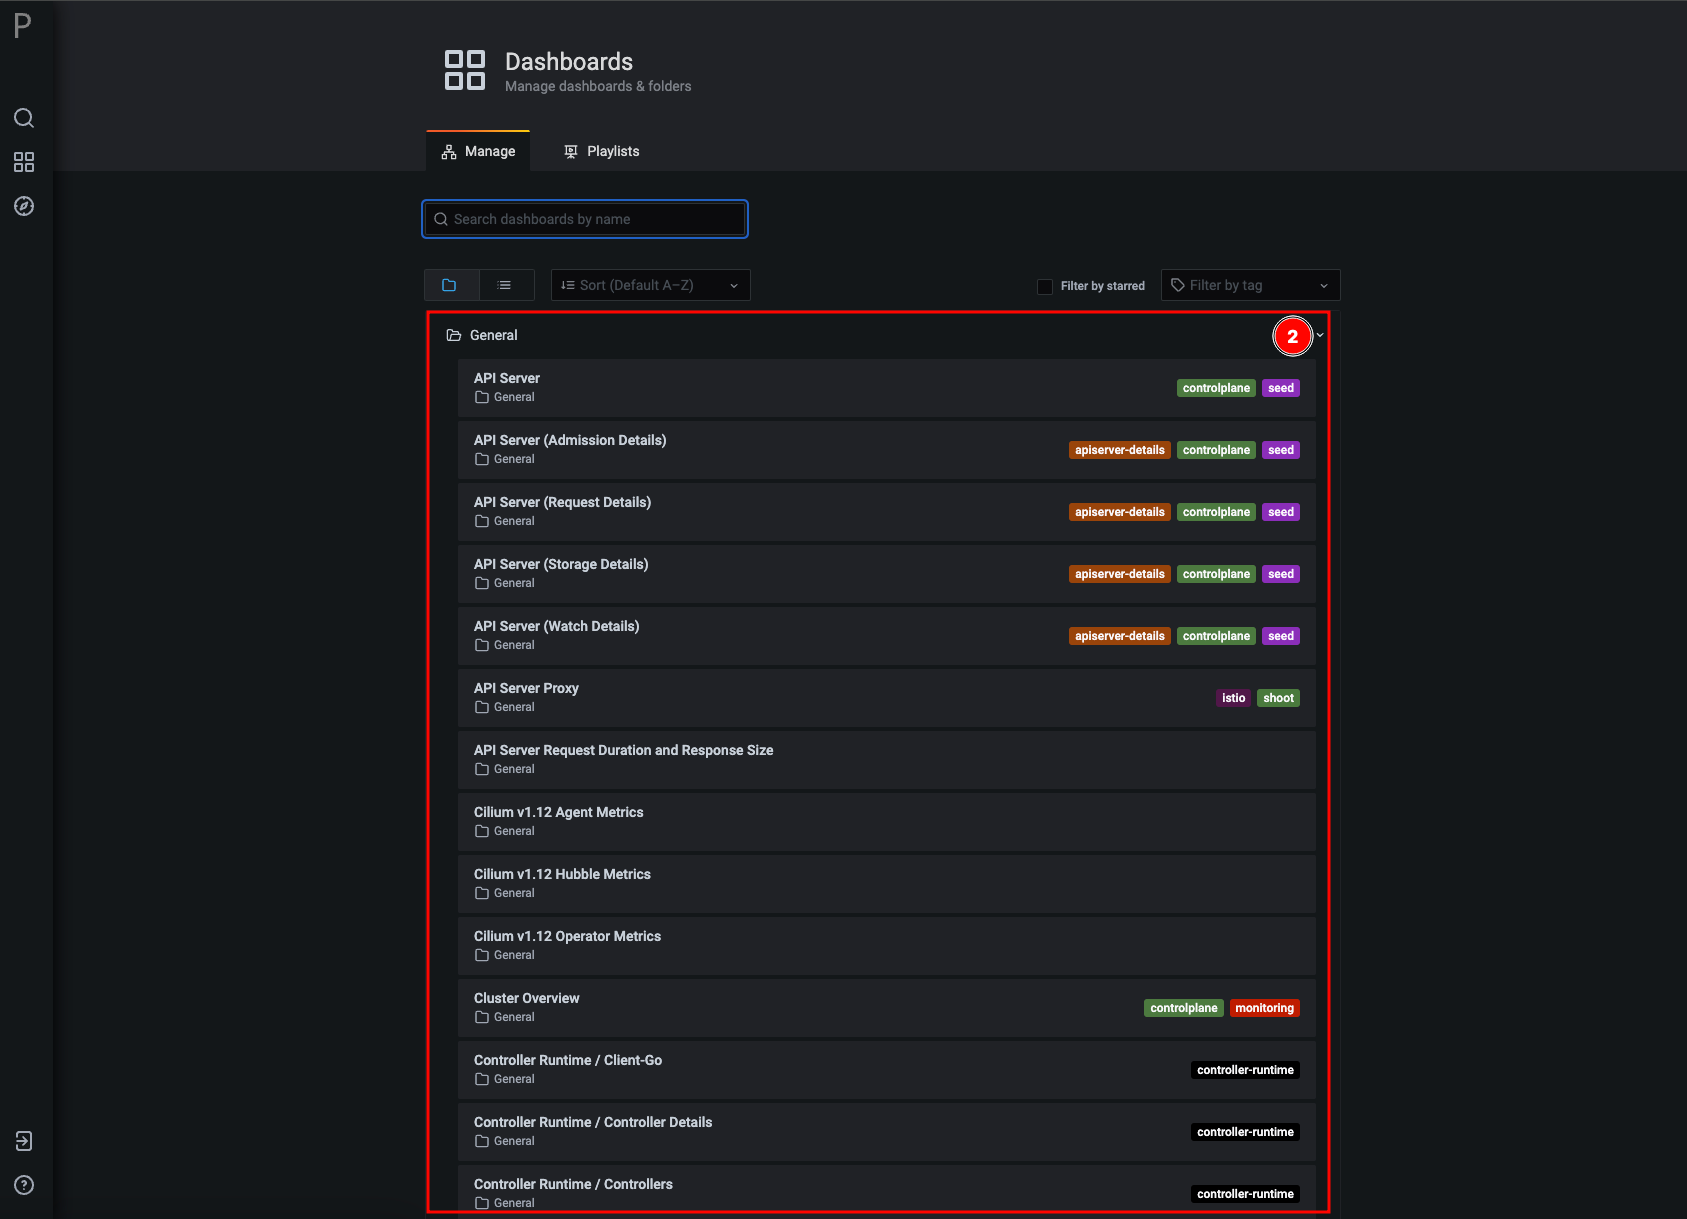
Available Dashboards
API Server
Dashboards covering the Kubernetes API Server of your Shoot cluster.
| Dashboard | Description |
|---|---|
| API Server | Overview of request rates, error rates, and latency of the API Server. |
| API Server (Admission Details) | Admission controller runtimes and errors in detail. |
| API Server (Request Details) | Breakdown of API requests by verb, resource, and status code. |
| API Server (Storage Details) | etcd storage metrics from the API Server’s perspective. |
| API Server (Watch Details) | Watch connections and their load on the API Server. |
| API Server Proxy | Metrics for the API Server proxy (Istio-based, Shoot network). |
| API Server Request Duration and Response Size | Latency histograms and response sizes for all API requests. |
| Kubernetes API Server Details | Extended metrics on goroutines, work queues, and internal API Server components. |
| Kubernetes API Server Watches | Count and latency of active Watch connections to the API Server. |
Control Plane
Status and overview of the Gardener-managed control plane components.
| Dashboard | Description |
|---|---|
| Cluster Overview | Overall cluster status: node count, pod count, resource utilization. |
| Kubernetes Control Plane Status | Availability and health of all control plane components. |
| Controlplane Logs Dashboard | Centralized log view for all control plane components (seed-side). |
| Shoot control plane resource usage by owner and container | CPU and RAM consumption of all control plane containers, broken down by owner and container name. |
| Machine Controller Manager | Status and metrics of the Gardener Machine Controller Manager (node lifecycle). |
ETCD
| Dashboard | Description |
|---|---|
| ETCD | Overview of the etcd cluster: latency, leader status, DB size. |
| ETCD Cluster Details | Detailed metrics on Raft, network, and peer communication. |
| ETCD Backup and Restore | Status and duration of etcd backups and restore events. |
| ETCD Compaction Job | Metrics for the etcd compaction job (cleanup of old revisions). |
Workloads and Nodes
Dashboards for your applications and nodes in the Shoot cluster.
| Dashboard | Description |
|---|---|
| Node Details | CPU, RAM, disk, and network metrics for individual nodes. |
| Node/Worker Pool Overview | Resource utilization and status across all worker pools. |
| Kubernetes Pods | Status, restarts, and resource usage of all pods (seed and Shoot context). |
| Kubernetes Deployments | Rollout status, replica count, and availability of all Deployments. |
| Kubernetes DaemonSets | Status and rollout progress of all DaemonSets in the Shoot. |
| Kubernetes StatefulSets | Status and replica count of all StatefulSets (seed and Shoot context). |
| Container Images | Overview of all container images in use within the Shoot cluster. |
Network
| Dashboard | Description |
|---|---|
| DNS | CoreDNS metrics: request rate, errors, and latency. |
| Reversed VPN OpenVPN Server (HA) | Status and metrics of the internal OpenVPN server for Shoot control plane connectivity. |
Cilium (CNI)
Available when Cilium is configured as the CNI plugin.
| Dashboard | Description |
|---|---|
| Cilium Agent Metrics | Cilium agent metrics per node: policy enforcement, connection state. |
| Cilium Hubble Metrics | Network flow metrics from Hubble: connections, drops, DNS. |
| Cilium Operator Metrics | Status and metrics of the Cilium Operator. |
Controller Runtime
Dashboards for Kubernetes controllers using the controller-runtime framework (including Gardener-internal controllers).
| Dashboard | Description |
|---|---|
| Controller Runtime / Controllers | Overview of all active controllers and their reconcile rates. |
| Controller Runtime / Controller Details | Detailed metrics on queue lengths and error rates per controller. |
| Controller Runtime / Webhooks | Overview of all registered Admission Webhooks. |
| Controller Runtime / Webhook Details | Latency and error rates per individual webhook. |
| Controller Runtime / Client-Go | client-go library metrics: cache, requests, and throttling. |
Monitoring Infrastructure
| Dashboard | Description |
|---|---|
| Prometheus | Internal status of the Prometheus instance: scrape duration, TSDB size, rules. |